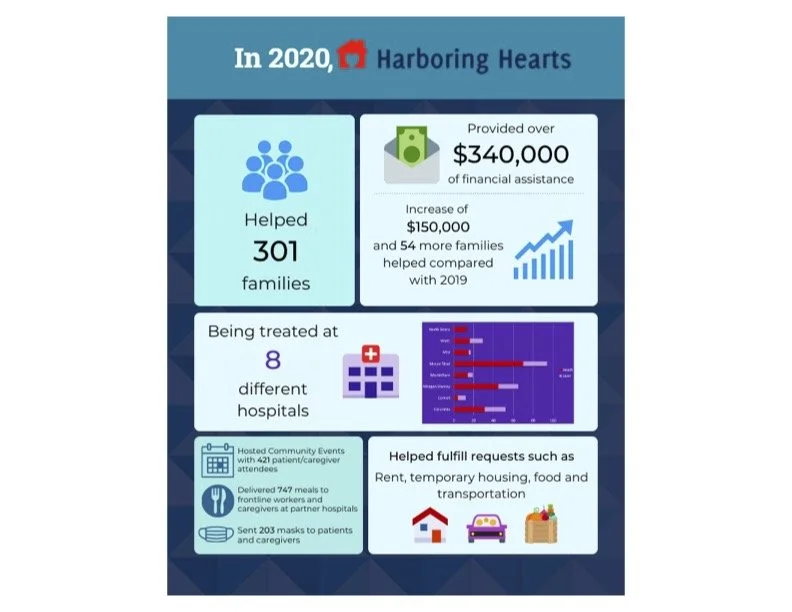
I’d like to have an infographic for 4 years of metrics (2021, 2020, 2019, 2018)…this is just to give you all a sense of what it can/might look like